Category: Math Readings
February 2, 2017
When we study the shapes, we often mention “geometric properties” — do not be scared by the words “properties”, its just some sure-things about a shape, like “circle is round”.
This is a fairly simple graph about the shapes.As shown, ABDE is the square; C is its centre, and the circle centred at C passes through all the four corners: points A, B, D and E.
Here are a number of properties about the square, and its circum-circle: (the circle passing through every corner of the square)
1) The four sides of a square are congruent (equal in length).
2) Each of the interior angle (at the corner) of the square is a right angle, thus these interior angles are congruent.
3) Each square has a centre, which is the intersection point of the two diagonals.
4) The two medians (traversal of the opposite sides) intersect at the centre.
5) The two diagonals of a square bisects each other.
6) Each diagonal divides the square into two regions with equal area, and the two diagonals divide the square into four equal-area regions.
7) Each square is inscribed into a circle, with the centre of circle to be located at centre of the square.
8) For any square, when rotating by 90 degrees, new square will be coincident (overlapping exactly) to the old square. This is true when rotating by any multiples of 90 degrees (since we can apply rotation again and again).
February 2, 2017
Using a compass, you can draw a circle at any place, with any radius.
Now let’s reverse the problem. Given a circle, do you know how to find its center? (Of course, once the circle is found, there shall be no problem at all to tell its diameter, or radius.) You only see the circle itself, there is no explicit indication on where the center is.
With two set of restrictions on what kind of tools you can use, there are actually two questions. In general, you can find the center using any convenient method, including copy-and-paste the circle onto a paper, and then fold it. In particular (from classical Euclidean geometry), where it’s required to do so with a ruler (with which you are allowed to draw lines and line segments only) and a compass (with which you are allowed to draw circles only).
See the following article on how to do it in general.
How to find the center of a given circle?
If you attempt to solve this problem with a ruler and a compass, then you are required to know how to make a perpendicular bisector. This will be discussed in another posting.
February 2, 2017
Venn diagram show relations among several sets.
Natural numbers, Integers, Rationals and Real numbers each define a set. Therefore, they can be represented by the Venn diagram.
Can we draw the diagram in such a way that the area of each circle is proportion to how many numbers are in the set represented by the circle (or whatever shape)? And first things first shall we try that?
Now let’s elaborate.
Natural numbers (or counting numbers) are like 1, 2, 3, .. We use them when counting.
Integers include all natural numbers as well as zero (0) and all negative numbers like -1, -2, -3, ..
Rational numbers are those that can be written as the ratio of two integers. Rational numbers includes integers; rational numbers can be either positive or negative.
Examples are like 1 &frac; 2 or 2 &frac; 3.
What’s the real numbers? Well, they includes both Rational and Irrational numbers. Irrational numbers are those that CANNOT be written EXACTLY as the ratio of two integers. Two famous examples are sqrt(2) as well as π. Indeed, as learning more, we find much more IRRATIONALS than RATIONALS — so that if we resize total REAL numbers to 100, then 100% will be IRRATIONAL, and ALMOST NOTHING is RATIONAL.
In Venn diagram, we typically represent one set by a circle. Two circles overlap indicates they have common elements. If one circle is completely contained in another circle, that indicates one set A is completely contained in another set B (that is, any element of set A is an element of set B).
February 2, 2017
π Ideas for Circles and Trigonometry:
Stories, Facts and Implications
1st Story: A Fun Way of Finding the π Value
Here is some facts found in somebody’s math venture:
He marks a point A on a circle. He then split the radius of the same circle into 4 equal segments – call the length of one segment as b.
He measured along the circle using b (explain the measurement). After 7 steps he stopped and label that point as B. — As he noticed, the arc from A to B is slightly greater than a quarter of the circle.
Now he returns to split the radius of this circle into 5 equal parts – call the length of one segment as d. Then he measured along the circle using d. After 7 steps he stopped and label that point as D. — As he noticed, the arc from A to D is slightly less than a quarter of the circle.
Having a second look, he has noticed as well that the line connecting B and D “almost” passes through the centre of the circle (or line BD is “almost” a diameter).
Pause for a minute. Try to draw a diagram according to this description. If not sure, look into the figure below for a check.
pi-SmartRatio
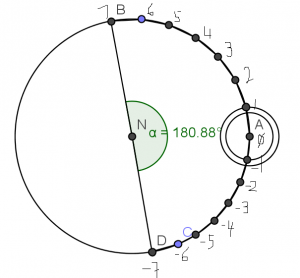
[As in this figure, N is the center of the circle, NA is the radius of the big circle, and the two small circles are of radius that is (1/4), resp. (1/5) of NA. From A, going through 7 steps to reach B; from A, going the other direction 7 steps to reach D. Pls. note the length of step in the two directions are not the same! ]
After some thought and calculation, he decided the approximate value of π. The value he’s found is 3.15 – which is pretty close to the true value. (For sure you know π is 3.14159, don’t you?)
Now is your chance to take part: how did he finds that value?
For a bonus question: he has decided that (7/4) radians is approximately 100 degrees. Do you agree? How did he come to that conclusion?
[Explain the concepts of radians if needed.]
February 1, 2017
About a decade ago, there was a great Tsunami happening in Asia.
What do you know about the Asian tsunami?
Read through the article first. Use the following numbers to fill in the blanks in the story.Think about which numbers make sense.
500 20 8,000; 2004 110,000 30,000 9.0
A tsunami triggered by a very large earthquake off the coast of the Indonesian island of Sumatra on December 26, ____, has left more than 150,000 people dead and millions homeless. Countries hit hardest by the disaster include Sri Lanka, Indonesia, India, Thailand, and the Maldives. Almost 75% of the deaths occurred in Indonesia, estimated at ____. Sir Lanka was second highest with about 20% of the estimated deaths, or ______ people lost that day. The rest of the deaths, approximately ____, occurred in the other nine countries affected by the tsunami.
The ____ foot wall of water, higher than a two-story building, swallowed entire villages. The tsunami waves were not only very high, they moved at a much faster speed than normal. These waves were comparable in size to those you see on some of the surfing movies; but those waves travel at 30 miles an hour, and the tsunami waves were moving more than fifteen times as fast at ____ miles an hour. The velocity of the force is what caused the destruction—a massive force that swept away everything in its path.
The earthquake causing this Tsunami was a destructive earthquake measuring ______ on the Richter scale, the fourth worst earthquake in recorded history. Earthquakes are measured on a Richter scale that has a range from 0 to 12; a 6.0 on the scale is a pretty bad earthquake.
(Story constructed from January 2005 news reports)